Motion Profile Comparison
The graphs on this page plot profiles (position, velocity, and acceleration) for an s-curve and trapezoidal curve. The curve parameters can be controlled dynamically with the sliders below. Both curves have the same target position, and are calculated so they reach the target at the same time.
The resulting curves are fed into a simple simulator replicating the behavior of two blocks connected by a spring. One block is driven exactly by a motion profile (replicating an ideal motor), and the other is driven by the force from the spring.

graphed using chartjs
Analysis
In general, the s-curve contains fewer high-frequency components than the trapezoidal curve. This means it's less likely to excite high-frequency vibrations. This makes sense, because the sharp jumps in acceleration of the trapezoidal curve profile theoretically contain a wide band of frequencies. As for the s-curve, the higher response at lower frequency is likely due to the larger acceleration (which is required to reach the target position at the same time as the trapezoidal curve).
Trapezoidal motion profiles result in the fastest motion due to constant maximum acceleration and deceleration. But the sudden jump in acceleration can excite high-frequency mechanical oscillations. These high-frequency oscillations can be mitigated by adding either mass or damping to the system. Belt-driven systems (like most 3d printers) likely have sufficient damping from the belts.
S-curve profiles ramp acceleration linearly and reduce high-frequency noise, but require more time to complete a move than an equivalent trapezoidal profile. Alternatively, an s-curve profile can be created which matches the completion speed of a trapezoidal profile by increasing maximum acceleration (as is done here). Depending on the driven system, this might be OK as the reduction in oscillations also reduces the maximum force presented to the drive mechanism. The plots above show this is the case with some frequencies, but not all (so be careful making this assumption). S-curve profiles also appear to contain higher magnitude low-frequency components, which could provoke resonant vibrations in systems with flexible linkages and high mass.
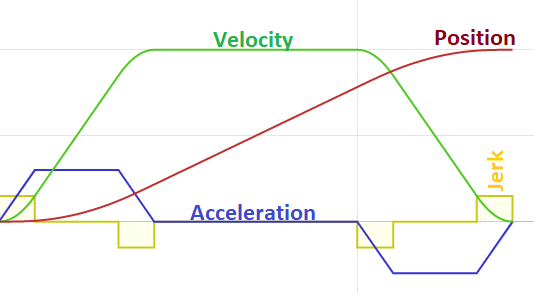
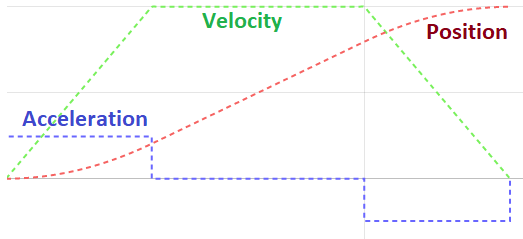
Trapezoidal Motion Profiles
A trapezoidal profile is composed of three sections:
S-Curve Motion Profiles
An S-curve profiles is composed of seven sections: